NSQIP: Using Caterpillar Graphs to Reduce Morbidity

Clifford Ko
|
Clifford Ko, director of the
National Surgical Quality
Improvement Program
(NSQIP) of the American
College of Surgeons presented
a highly informative discussion
of "surgical quality from
bench to bedside". Citing the
American College of Surgeons
mission statement "to improve
the care of surgical patients in
an optimal and ethical environment", he addressed the
basic question: How do we know that we are doing it
right?
Many Canadian surgeons do not realize that the
American College of Surgeons is a North American organization
that clearly identifies itself as "founded by the
surgeons of the United States and Canada". The College
has had many Canadian presidents including William
Gallie.
NSQIP started at the Veterans' Administration
Hospitals in the United States in response to an inquiry
from the US Congress into what seemed to be an unacceptably
high mortality in V.A. Hospital surgery. This
initial study was carried out in over 200 V.A. Hospitals.
The often quoted explanation "Our patients are sicker",
based on presumed tobacco, alcohol and age factors was
examined using risk - adjusted data. The Hawthorne
effect was immediate - observed behavior is improved
behavior. The NSQIP program reduced the mortality
by 27%, the morbidity by 45%, the length of stay from
9 to 4 days, and increased patient satisfaction. In 2004,
the American College of surgeons initiated its NSQIP
program. Its critical features are risk adjusted outcomes;
clinical chart - based data (rather than administrative
data), trained abstractors who are certified and examined
yearly; audited data, multi-specialty expertise; and closing
the loop with improvement tools.
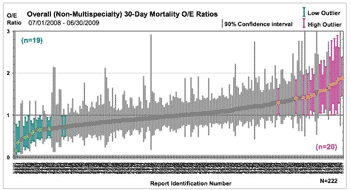
The program records 135 data points per case and reports the observed-to-expected (O/E) ratios of all
events--such as mortality and a range of complications-
-on caterpillar graphs. Individual hospitals are notified
of their standing within the group, but the identity of all
the other hospitals is withheld.
The analysis is refined so that hospitals are ranked
on the basis of the complexity of the procedures that
they perform. For example, hospitals that perform
esophagectomies and complex vascular procedures are
not compared directly with hospitals performing only
hernia
|
repairs, appendectomies and cholecystectomies.
In general, clinical data are far more sensitive than
administrative data. Administrative data missed 90%
of complications because the charts were not examined.
45% of complications occur after discharge, so in - hospital
complication rates are deceptive. Dr. Ko gave the
example of colon resections where the average length
of stay is 6 days and the average time of presentation of
deep surgical site infections is at 9 days. The caterpillar
graph has proved to be very motivating, as surgeons and
hospitals strive to improve their O/E ratio. The NSQIP
program also provides a dashboard of complications,
and run charts that help identify changes in incidence of
complications overtime. The NSQIP feedback loop provides
guidance on the best practices for quality improvement,
for example 1. the requirement that antibiotics
be given within one hour of the incision, are stopped
24 hours later, and are not appropriate for the irrigation
solutions; 2. maintaining a normal body temperature
during surgery and the postoperative period; 3. use of
clippers rather than razors for shaving the surgical site
etc. The cost of a complication on average is $10,000 in
hospital fees. 250 complications per year cost a hospital
$2.5 million.

In the bench analysis of the NISQUIP data, the
group found that measuring 5 variables is as helpful and
far more economical than measuring 20 or 30 or 50.
In addition, some complications can be grouped into
clusters. For example, cardiac, neurologic, and other
complications.
UHN is starting a NSQIP program in General
Surgery under Tim Jackson. Michael Fehlings asked
about the business plan for NSQIP. It clearly costs
money, but saves money as well. In general, the answer
is that accounting is not standardized enough to show
where the savings have been realized. The public is able
to find individual hospitals on the caterpillar graph, only
500 of the 5000 hospitals in the United States are in the
NSQIP program. There are available NSQIP targets for
nine subspecialties.
David Urbach with notes from Clifford Ko
|